
Article Contents
Introduction
The traditional process of evaluating answer sheets has long been plagued by limitations, including a lack of audibility, quality checks, and comprehensive analytics for student and faculty performance.
However, with the advent of on-screen evaluation systems, these challenges are being overcome, revolutionizing decision-making processes and providing valuable insights.
In this article, we will explore the benefits of on-screen evaluation analytics and how they contribute to measuring student performance, faculty effectiveness, and evaluation efficiency.
Learn How Eklavvya Enabled Leading University to Improve its Evaluation Process.
Understanding the Onscreen Marking System
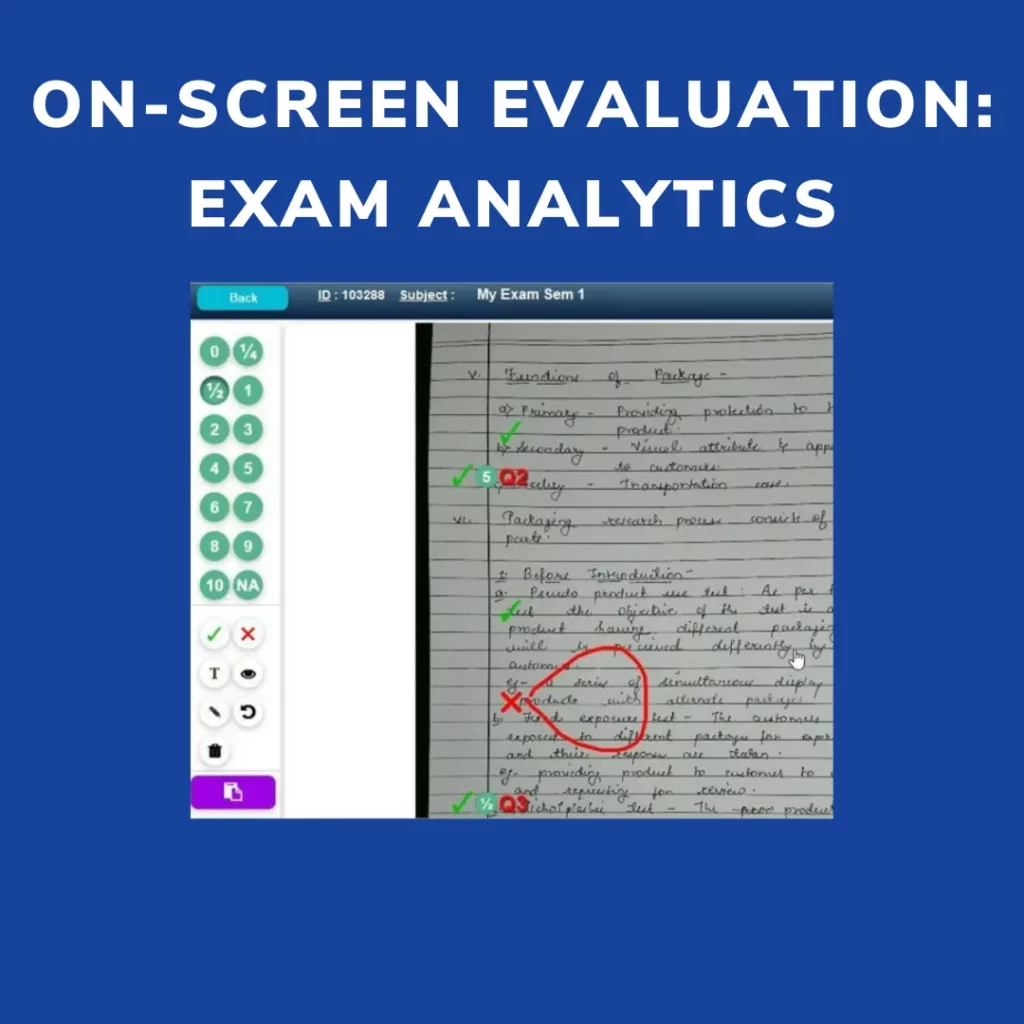
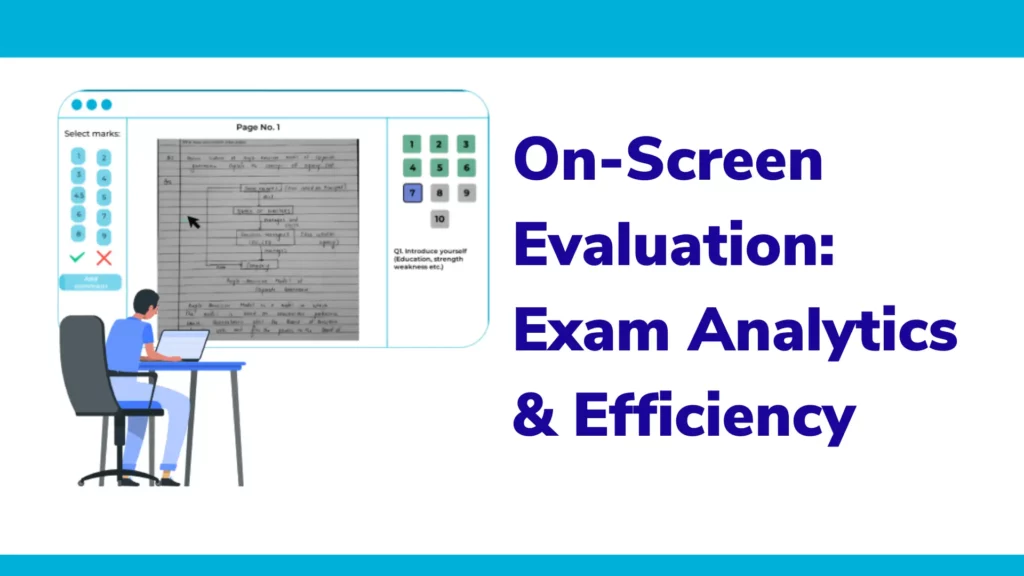
The on-screen marking system allows examiners or faculty members to digitally evaluate answer sheets by scanning physical copies.
This process empowers evaluators to access and assess the answer sheets from any device, eliminating the constraints of physical presence. With this system, every aspect of the evaluation process becomes streamlined and digitized, resulting in improved efficiency and accuracy.
Limitations of Traditional Evaluation Methods
Before delving into the benefits of on-screen evaluation analytics, it’s essential to acknowledge the shortcomings of traditional evaluation methods.
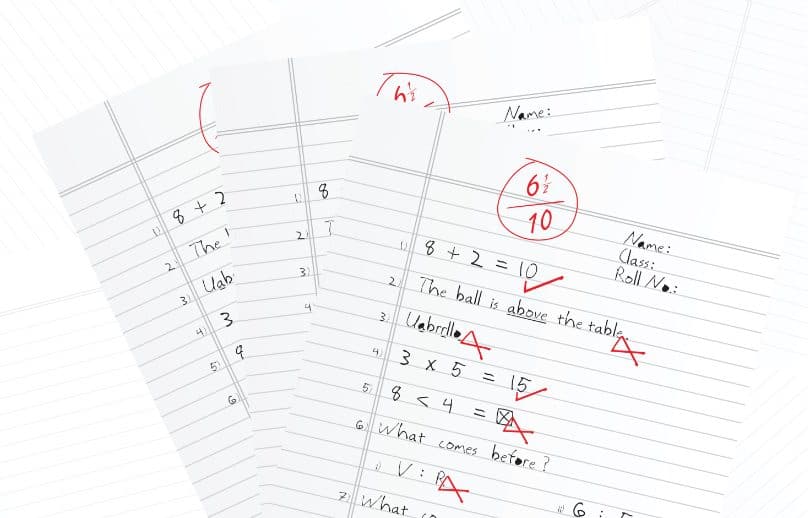
The lack of audibility and quality checks in traditional evaluations makes it challenging to maintain consistency and fairness. Additionally, the absence of comprehensive analytics hinders decision-makers ability to gain insights into student performance, faculty effectiveness, and evaluation accuracy. These limitations have long impeded the progress and effectiveness of the education system.
Harnessing the Power of On-Screen Evaluation Analytics
The on-screen evaluation system provides decision-makers with a centralized dashboard that displays detailed analytics related to the answer sheet checking process. This dashboard becomes a one-stop solution for tracking progress, making data-driven decisions, and ensuring accountability. Let’s explore the various analytics reports that can revolutionize the evaluation process.
Booklet Check Count: Tracking Progress
The “booklet check count” report provides a comprehensive analysis of the number of evaluated answer sheets per day. This report presented graphically every week and customizable within specific date ranges, empowers decision-makers to track progress effectively.
By visualizing the evaluation count over time, they can identify any lagging areas and take proactive measures to ensure timely completion. If you are the Controller of Examinations or Registrar, then such a report would provide you with insights about evaluation progress and guidance if the result processing activity can be completed within the stipulated deadline.
The system can provide detailed analytics of stream and subject-wise evaluation progress on a dashboard.

Examiner Analysis Reports: Unleashing Faculty Potential
The on-screen marking system offers a range of analytical reports tailored specifically for examiners. These reports enable decision-makers to analyze each examiner’s performance, evaluate efficiency, and identify potential quality issues.
By selecting the stream and subject, decision-makers can access the examiner’s day-wise checking analysis, which provides valuable insights into the number of answer sheets evaluated and graphical representations of the evaluation process.
Furthermore, these reports highlight the time taken by each examiner, revealing valuable statistics that can uncover potential discrepancies and inconsistencies. Such insights allow decision-makers to nurture faculty potential, improve evaluation accuracy, and ensure fairness.
Student Analytics: Unlocking Potential
In addition to faculty analysis, on-screen evaluation systems provide powerful analytics reports that unlock the potential of students. These reports offer a comprehensive understanding of student performance, highlight areas for improvement, and enable educators to tailor teaching methods and materials accordingly.
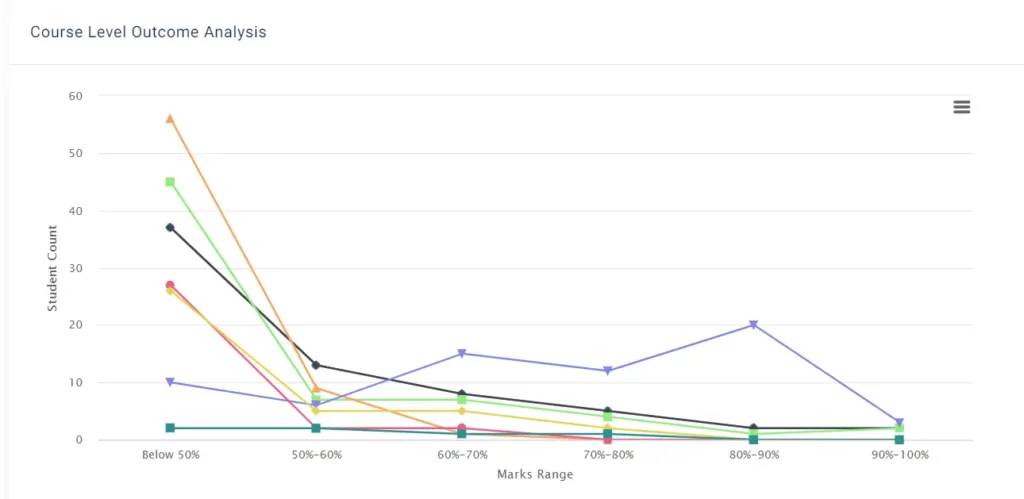
The course level outcome analysis report breaks down students’ scores into specific percentage ranges, shedding light on overall batch performance and identifying trends among groups of students. This information becomes invaluable in adapting teaching strategies and addressing areas where students struggle the most.
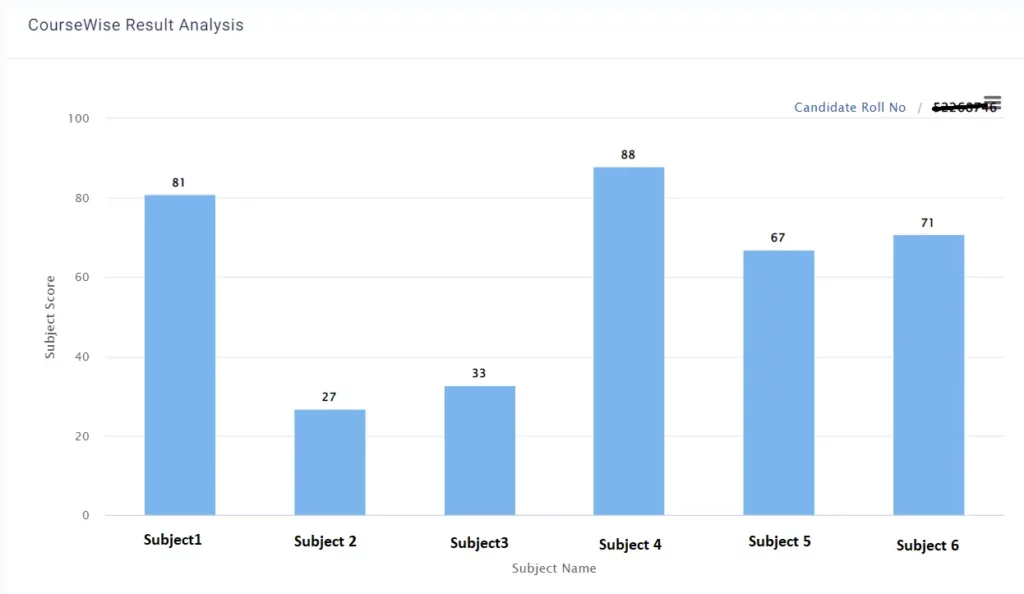
The course-wise result analysis allows decision-makers to view individual candidates’ performances across multiple subjects. With graphical representations, decision-makers can easily analyze each candidate’s progress, identifying strengths and weaknesses.
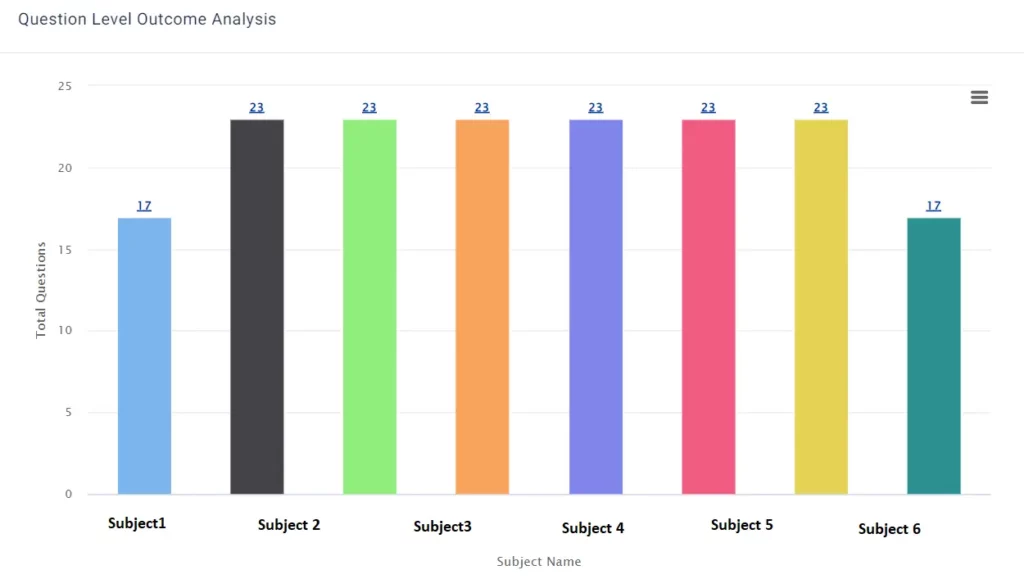
Question-level outcome analysis provides insights into the number of students attempting specific questions on particular topics. This data helps decision-makers assess the effectiveness of instructional content and identify areas that require additional attention.
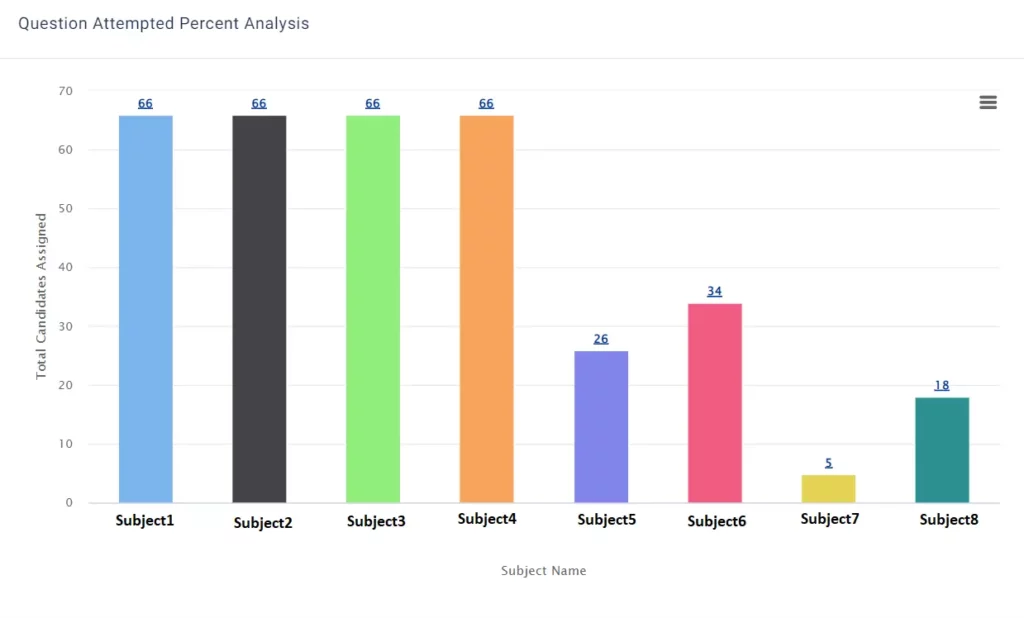
The question attempt percentage analysis reveals the percentage of students attempting specific questions. Identifying questions with low attempt rates can indicate unclear concepts or issues with the question itself, allowing educators to address these concerns proactively.
Faculty Performance Analysis: Ensuring Consistency
The on-screen evaluation system also empowers decision-makers to analyze faculty performance during student assessments. Reports displaying the number of papers evaluated by each faculty member and average scores assigned to each question offer valuable insights into individual faculty performance.
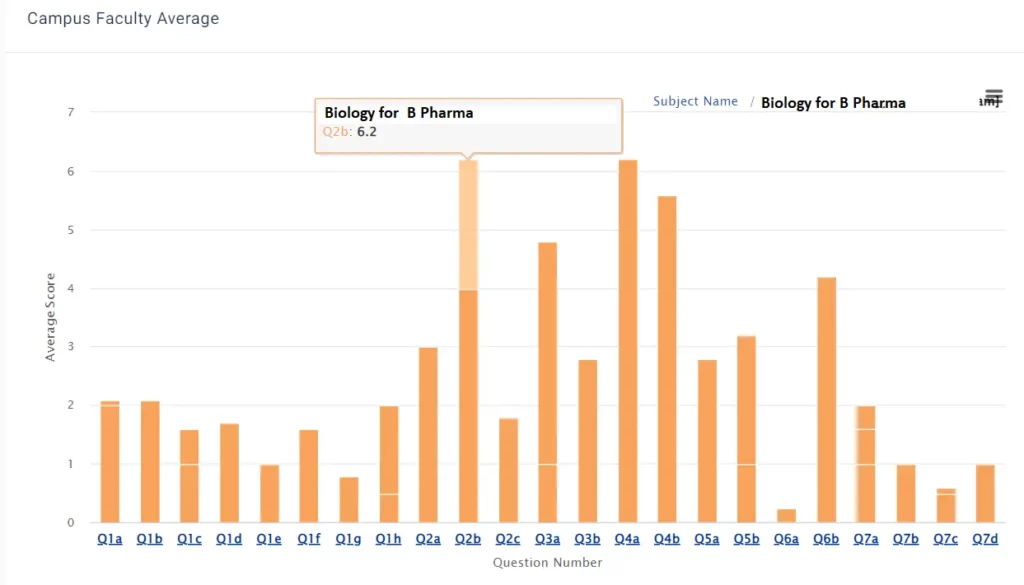
By comparing marking schemes and patterns, decision-makers can ensure consistency in grading practices across all evaluators, promoting fairness and accuracy in evaluations.
Conclusion
On-screen evaluation systems have revolutionized the evaluation process, providing decision-makers with a wealth of actionable analytics and insights. From tracking progress to assessing faculty performance and unlocking student potential, these systems enable data-driven decision-making, improve efficiency, and enhance the overall evaluation process.
By embracing on-screen evaluation analytics, educational institutions can pave the way for a more effective, fair, and insightful approach to measuring student performance and fostering academic growth.
Here are some of the key features of the Onscreen Evaluation System to explore and get started.

![How Government-Led Exams at 250+ Locations Are Setting New Standards of Integrity [Case Study]](https://www.eklavvya.com/blog/wp-content/uploads/2024/04/Enhancing-Exam-Integrity-Government-Certification-in-250-Locations-150x150.webp)
![Transforming Central Govt. Exams Evaluation: How Onscreen Marking is Leading the Charge [Case Study]](https://www.eklavvya.com/blog/wp-content/uploads/2024/04/How-Onscreen-Marking-Revolutionized-Central-Govt-Exams-Case-Study-1-150x150.webp)


![How Onscreen Marking Revolutionized Central Govt Exams [Case Study]](https://www.eklavvya.com/blog/wp-content/uploads/2024/04/How-Onscreen-Marking-Revolutionized-Central-Govt-Exams-Case-Study-1-300x300.webp)